
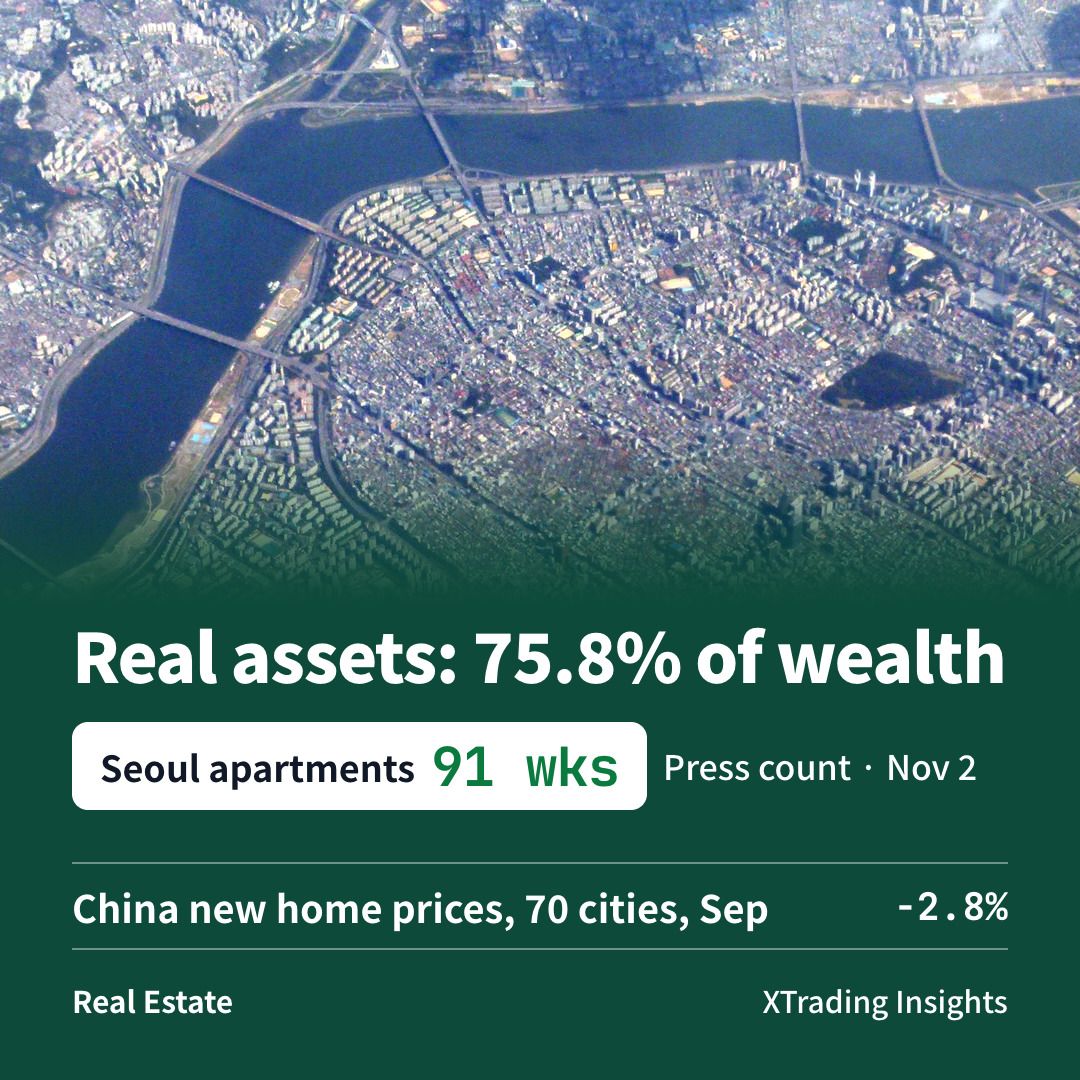
Seoul apartment prices rose 0.07% in the week to November 2, according to the Korea Real Estate Board, the state agency that tracks home prices. By press counts, that makes 91 straight weeks of gains. As of October 26, prices were up 8.73% since the start of the year.
House prices are big news in South Korea because households have put both their wealth and their debt into housing. Setting Korea beside the US, Japan and China shows how far that goes, and the record of other countries shows where the damage appeared first when prices fell.
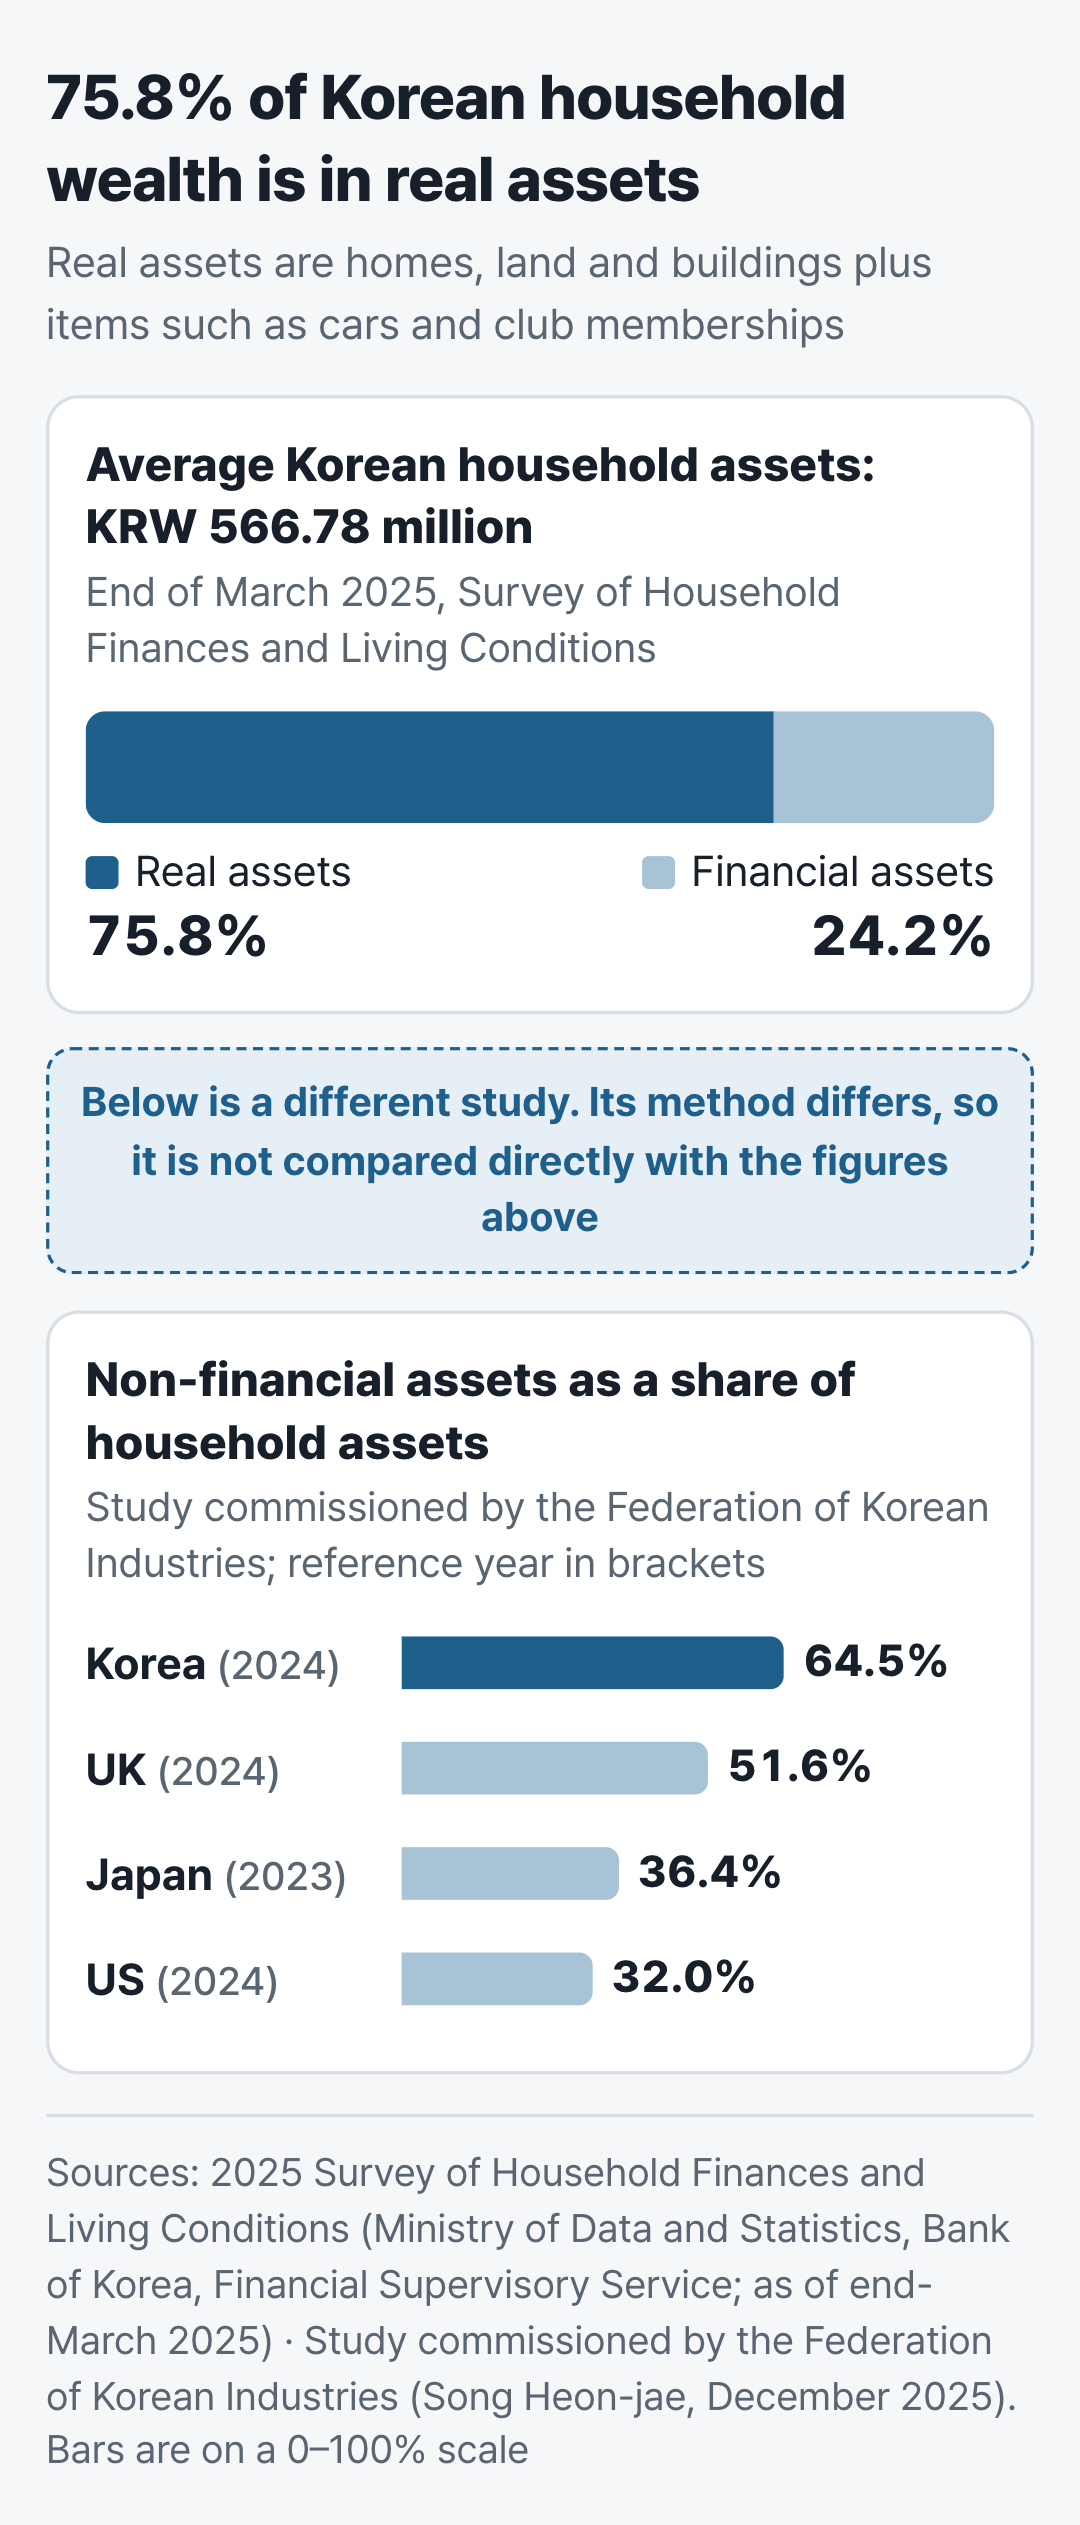
75.8% of Korean household wealth is in homes, land and other real assets
The 2025 Survey of Household Finances and Living Conditions, run each year by the Ministry of Data and Statistics, the Bank of Korea and the Financial Supervisory Service, put average household assets at KRW 566.78 million at the end of March. Real assets made up 75.8% of that, and financial assets such as deposits and shares made up 24.2%. Real assets are property (homes, land and buildings) plus items such as cars and club memberships. Property alone was 71.1%.
Korean households have also seen housing do better than shares. In a May 2026 report, the Bank of Korea's research department found that households without a home moved 70% of their stock market gains into property. The reason it gave was that property has had lower volatility and higher returns than stocks. In other words, house prices have swung less than share prices and risen more.
House prices are also high relative to income. The price-to-income ratio (PIR) expresses the price of a home as a multiple of a household's annual income. KB Real Estate, part of KB Kookmin Bank, calculates it from the median income and median home price of people who took out apartment mortgages at the bank. On that basis, Seoul's PIR was 10.2 in the first quarter of 2026. A household would have to save all of its income, spending none of it, for about 10 years to pay for the home. Numbeo (numbeo.com), a private website that compiles prices submitted by its users, divides the price of a 90-square-meter apartment by household income, taken as 1.5 times the average after-tax salary. By that method, Seoul scored 30.0 in mid-2026, against 16.7 for London and 10.9 for New York. Incomes in Seoul have not kept up with house prices. The two measures are calculated differently and are not compared with each other.
An international report sets out when a multiple counts as expensive. The 2026 edition of Demographia International Housing Affordability rates a PIR of 3.0 or less as "affordable," 5.1 to 8.9 as "severely unaffordable" and 9.0 or more as "impossibly unaffordable." Seoul is not in that survey and the method is different, so Seoul cannot be compared with it directly.
Korean households have also built up a lot of debt
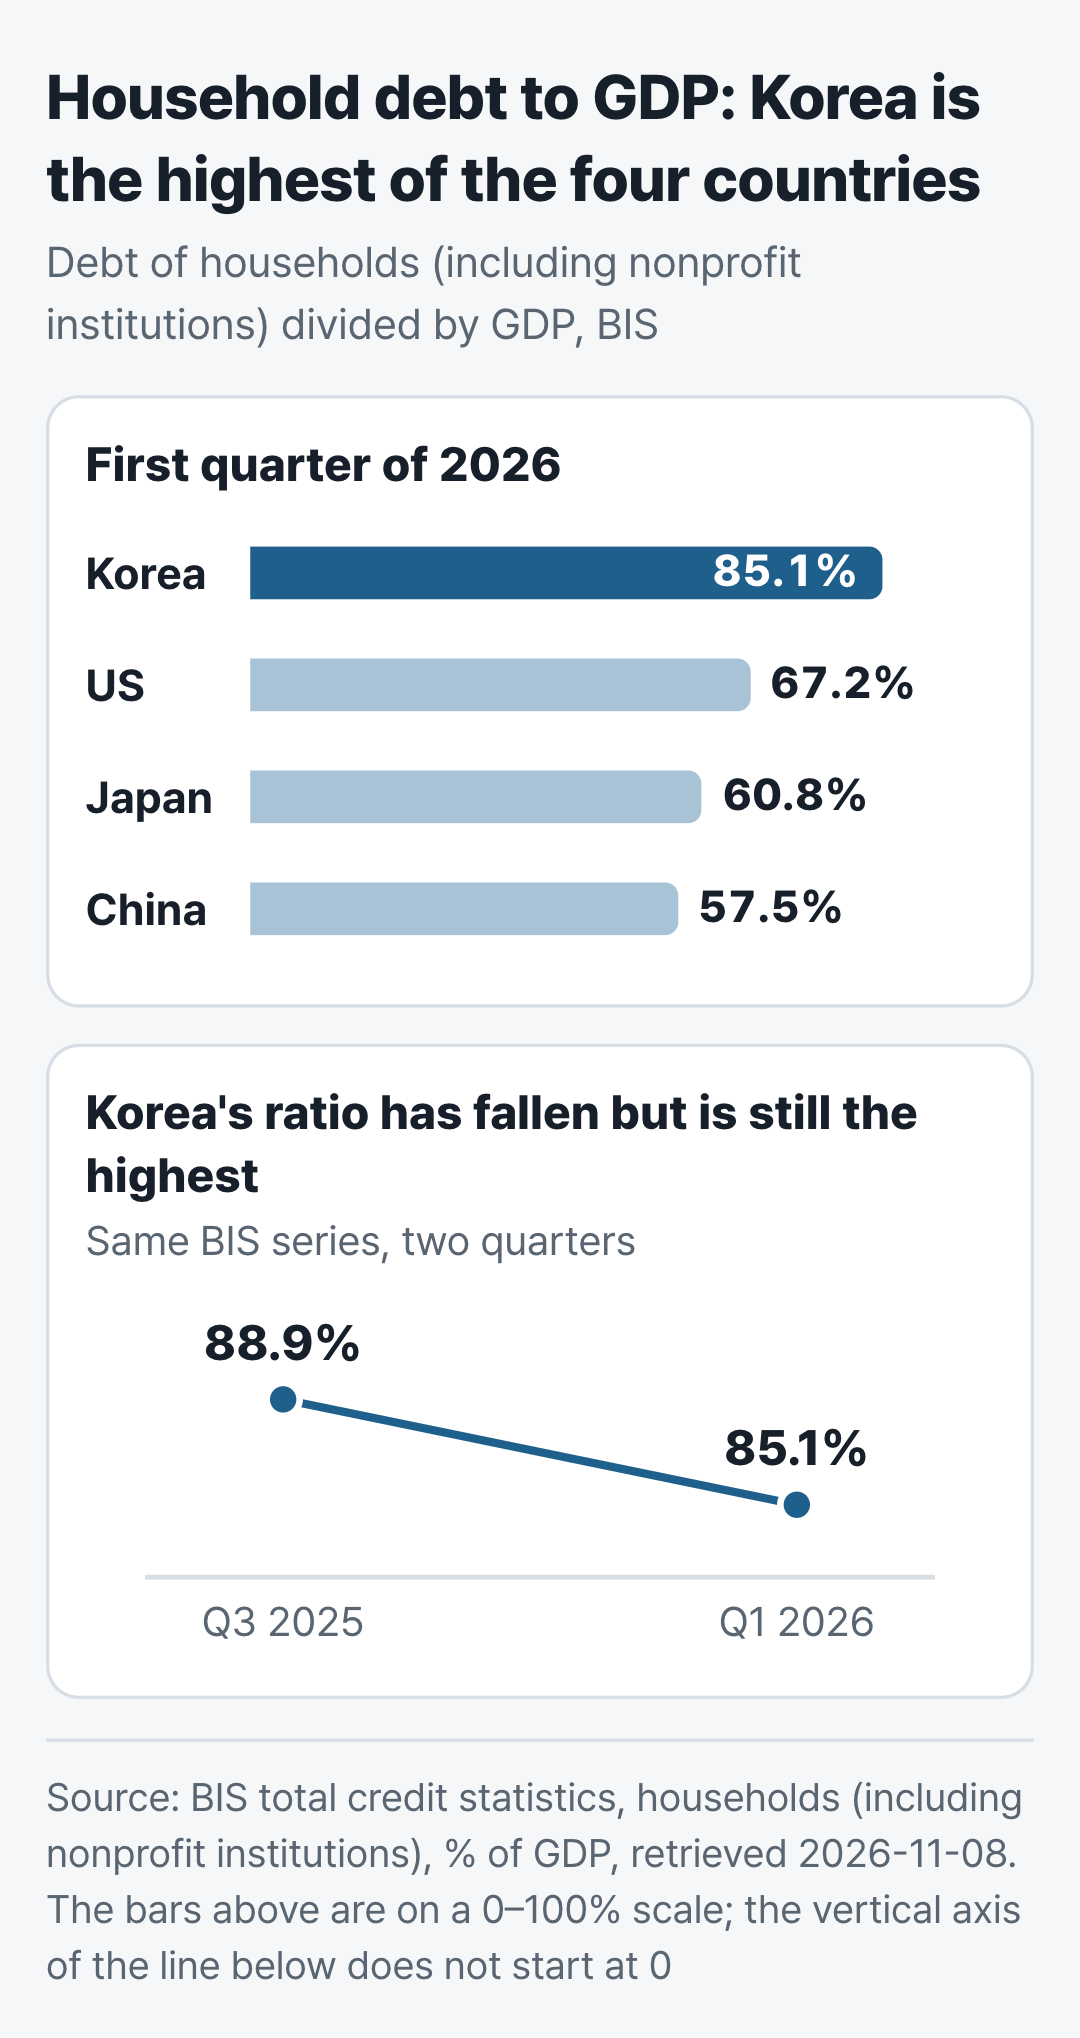
Household debt is measured against the size of the economy. Gross domestic product (GDP) is the value of everything a country produces in a year. Figures from the Bank for International Settlements (BIS), an organization of central banks, put Korean household debt at 85.1% of GDP in the first quarter of 2026. That is down from 88.9% in the third quarter of 2025, but it is still the highest of the five countries in the table below. The Bank of Korea put property-related borrowing by households and businesses at KRW 2,792.5 trillion at the end of the second quarter of 2026 (preliminary), equal to 94.4% of GDP.
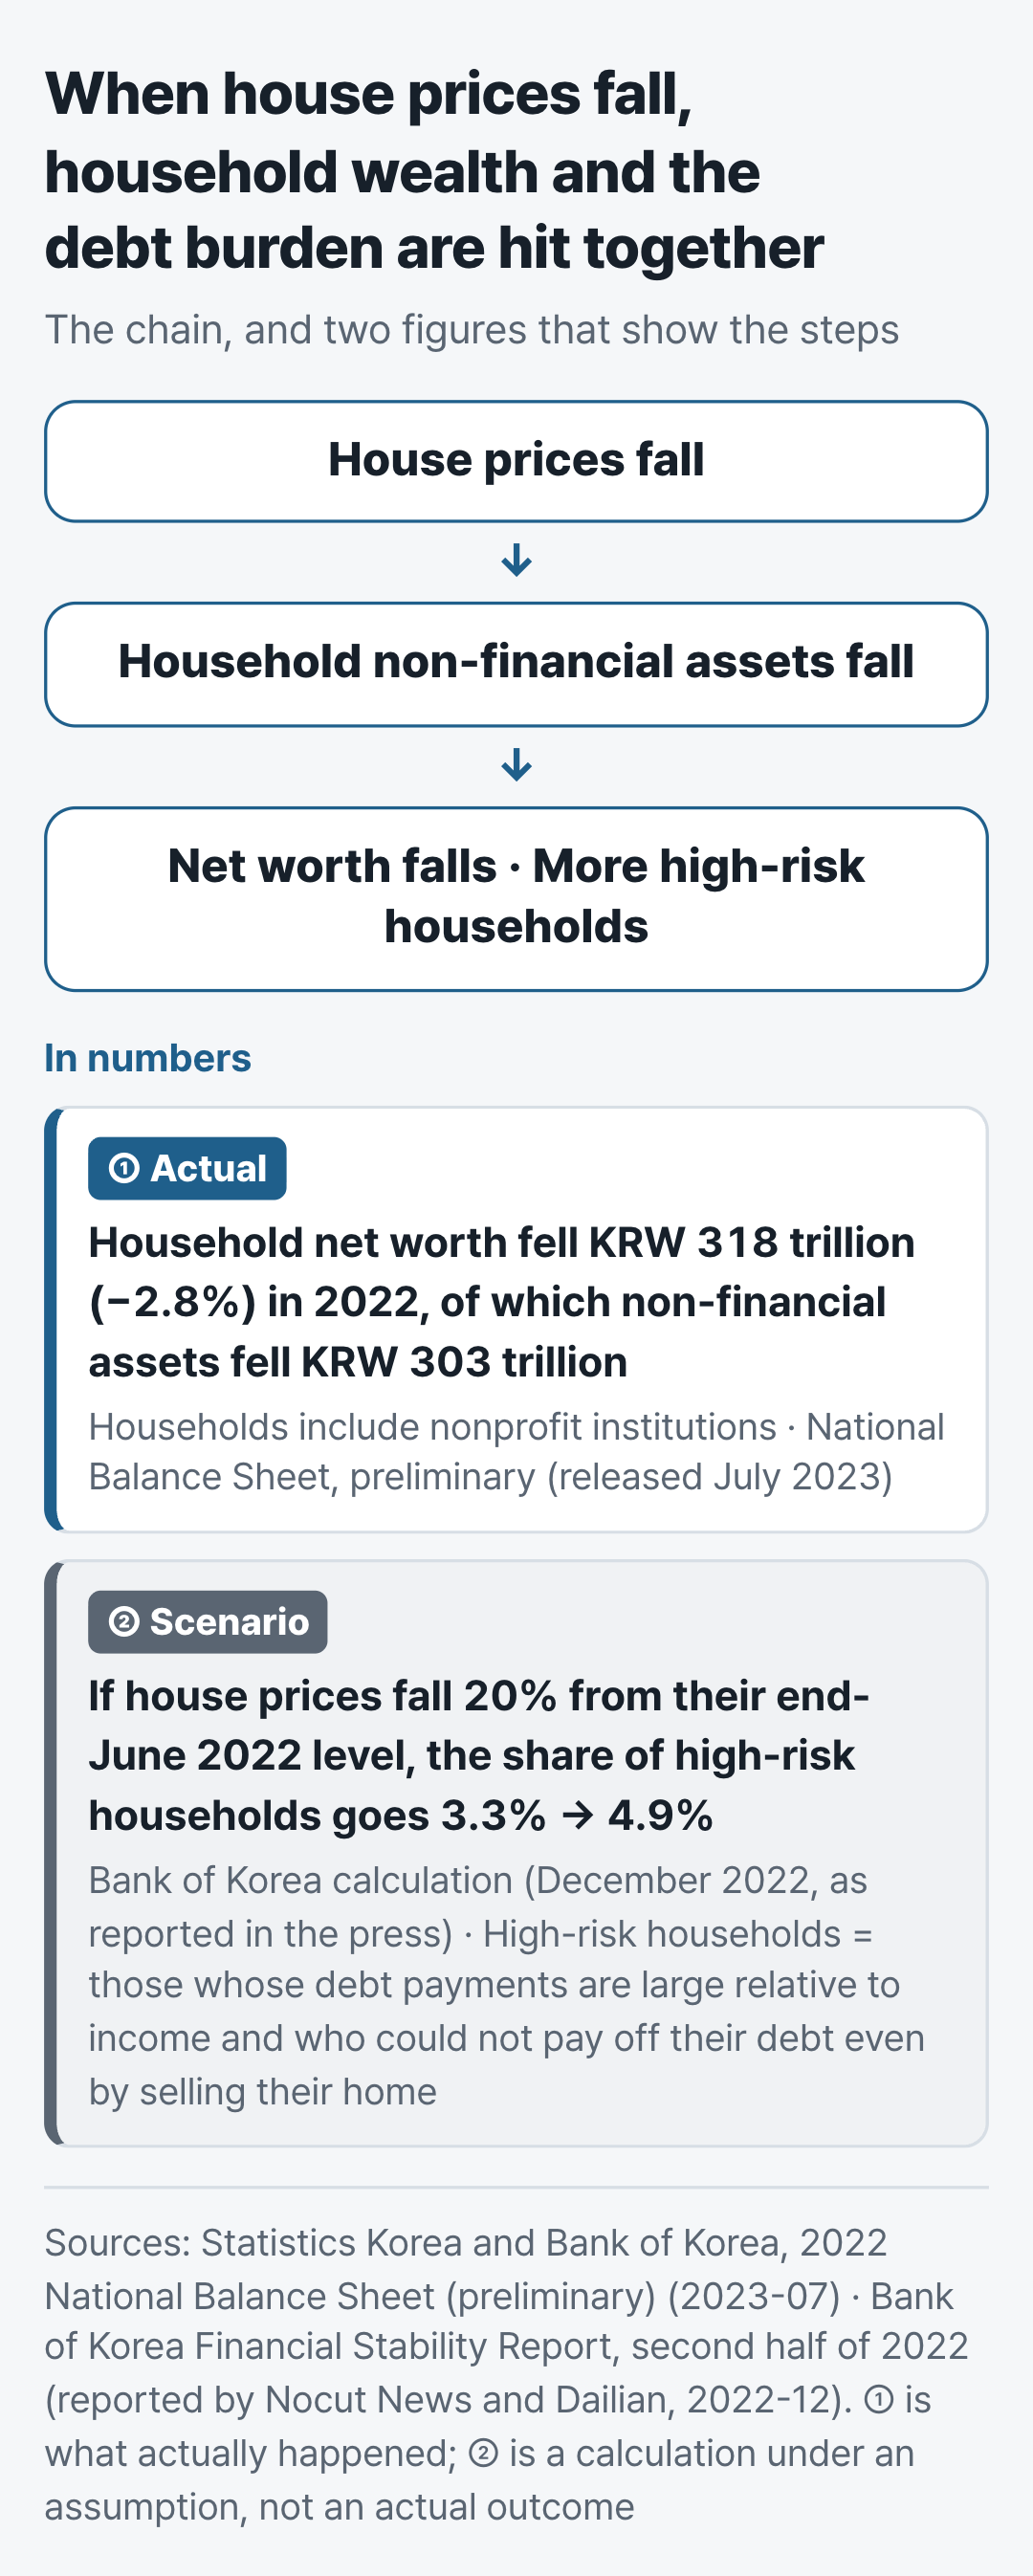
When the debt sits with households, households are the first to feel a fall in house prices. In December 2022 the Bank of Korea calculated what would happen if house prices fell 20% from their level at the end of June that year. In that scenario, the share of high-risk households went from 3.3% to 4.9% (as reported in the press). High-risk households are those whose debt payments are large relative to their income and who could not pay off their debt even by selling their home. In 2022, a year when house prices did fall, household net worth (assets minus debt, with nonprofit institutions included in the household sector) fell by KRW 318 trillion, or 2.8%. Most of the decline came from non-financial assets such as homes and land, which fell by KRW 303 trillion (Statistics Korea and the Bank of Korea, preliminary figures released in July 2023).
Rising prices bring their own concerns. At a press conference on October 23, 2025, the Governor of the Bank of Korea said the current rise in property prices was eating into the country's growth rate and its potential growth rate. The potential growth rate is the pace at which an economy can grow without strain. In September 2026 the Bank of Korea again pointed to rising house prices in the Seoul metropolitan area and wrote that concern was growing about a build-up of financial imbalances, in which debt and house prices grow much faster than income.
Korea beside other countries
| Country | Non-financial assets (% of household wealth) | Household debt (% of GDP, Q1 2026) | Recent house prices |
|---|---|---|---|
| Korea | 64.5% (2024) | 85.1% | Seoul apartments up for 91 straight weeks (as of November 2, press count) |
| US | 32.0% (2024) | 67.2% | House prices in August 2026 up 2.4% from a year earlier (Federal Housing Finance Agency) |
| Japan | 36.4% (2023) | 60.8% | Land prices on January 1, 2026, national average, up 2.8% from a year earlier (official land prices, Japan's land ministry) |
| China | — | 57.5% | New home prices in 70 cities in September 2026 down 2.8% from a year earlier (Reuters tally) |
| UK | 51.6% (2024) | 72.6% | — |
Non-financial assets are homes, land and other assets that are not financial. The shares come from a study commissioned by the Federation of Korean Industries, a business lobby group (December 2025). Years in brackets are the reference years. Korea's 64.5% comes from a different survey method from the 75.8% above. Household debt figures are from the BIS. The recent price measures differ by country in what they track (home prices or land prices) and over what period, so the rows are not compared with each other. A dash marks a cell where no figure on the same basis was found.
Korea has the highest share of wealth in homes and land and the highest household debt of the five countries in the table. Other countries have seen money pour into housing and then come to a halt. Around the 2008 financial crisis, US house prices nationwide fell 22.2% from their peak in June 2007 to January 2012 (FHFA House Price Index, calculated from figures not adjusted for seasonal swings). They have since risen again, and in August 2026 they were 2.4% higher than a year earlier. Japan and China took different paths after the halt.
Japan's land prices took 27 years to rise again
The land price index for Japan's six largest cities (Tokyo's 23 wards, Yokohama, Nagoya, Kyoto, Osaka and Kobe) peaked in September 1990 (Japan Real Estate Institute). It then fell for a long time. In March 2018, commercial land for shops and offices was still 82.7% below the peak, and residential land was 65.7% below (Cabinet Office of Japan).
The national average land price, which the Japanese government surveys every year as of July 1, last rose in 1991. It did not rise again until 2018, 27 years later (Prefectural Land Price Survey, Ministry of Land, Infrastructure, Transport and Tourism).
Land prices are now rising. Official land prices as of January 1, 2026 were up 2.8% on the national average and 5.7% in the Tokyo area from a year earlier, the fifth year in a row of gains (Ministry of Land, Infrastructure, Transport and Tourism).
Japanese households now hold more of their wealth in financial assets than in homes and land. Non-financial assets are 36.4% of household wealth (2023, from the study commissioned by the Federation of Korean Industries). Within financial assets, cash and deposits are the largest item. Bank of Japan figures show that 47.2% of Japanese households' 2,386 trillion yen in financial assets at the end of March 2026 was in cash and deposits. For US households the share was 10.7%.
Japan is a case of prices taking a long time to recover after they turned. In China, the debt had built up somewhere else.
In China, the debt built up at developers, and the developers fell first
Chinese households also hold much of their wealth in housing. A survey of more than 30,000 urban households by the People's Bank of China, the central bank, in October 2019 found that housing made up 59.1% of total household assets (urban households only, 2019 survey; rural households were not included). But in China the debt problem lay less with households than with the developers that build apartments. Chinese household debt is 57.5% of GDP, the lowest of the five countries in the table.
Chinese developers had for years grown by relying on borrowed money (Caixin). The government was reported to have seen that debt as inflating a housing bubble and putting the whole financial system at risk.
So the government set limits. In August 2020, the People's Bank of China and the Ministry of Housing and Urban-Rural Development reportedly met 12 large developers and set out three tests that would stop heavily indebted companies from borrowing more. The government did not publish them as an official document.
- First, liabilities must not exceed 70% of assets. Payments that buyers make before an apartment is finished are booked as liabilities, but they are left out of this calculation.
- Second, net debt, meaning debt left after subtracting cash on hand, must be smaller than the company's own capital (equity).
- Third, cash must at least cover the debt that falls due within a year.
The more of the tests a company failed, the less new borrowing it was allowed, and a company that failed all three could not borrow more, according to reports. Because they were lines not to be crossed, they became known as the "three red lines."
After the tests came in, large developers missed debt payments one after another.
- Evergrande was described as the world's most indebted developer (Reuters). In December 2021, after it missed interest payments on bonds owed to foreign investors by the deadline, the credit rating agency Fitch ruled that it had failed to pay its debt when due.
- Country Garden had for several years been China's largest developer by contracted sales (Bloomberg). It did not pay interest on a dollar bond that was due in September 2023, even after a 30-day grace period, and in October the trustee acting for the bondholders declared it in default.
- In January 2024 a Hong Kong court ordered Evergrande to be liquidated, meaning wound up and its remaining assets sold to repay its debts. At the time Evergrande had more than $300 billion in liabilities and $240 billion in assets (Reuters).
Would-be buyers held back too. In October 2023 Bloomberg reported that some people had put off buying a home because they feared developers might not finish building it.
Policy now points the other way. With prices falling, the government has been changing the rules to make it easier to buy a home.
- In May 2024 it cut the minimum share of the price that a buyer must pay with their own money from 20% to 15% for a first home, and from 30% to 25% for a second home. Buyers with less saved could now buy.
- The same month it scrapped the national rule that had barred banks from setting mortgage rates below a fixed floor. Banks could now offer lower mortgage rates.
- In September 2024 a meeting of the Politburo, the Chinese Communist Party's top leadership body, called for halting the decline in the property market and stabilizing it.
- In September 2026 the government said that for first-time buyers taking out new mortgages from October 1, it would pay part of the interest, equal to 1 percentage point a year on the amount borrowed, for up to five years. The scheme covers homes of 120 square meters or less that cost 1.5 million yuan or less.
Even so, new home prices in 70 cities in September were 2.8% lower than a year earlier (Reuters and Trading Economics tallies).
When prices turned, the damage showed up where the debt was
In Japan, land prices took 27 years to rise again after they turned. In China, the debt had built up at developers, and once the government cut off their borrowing, the developers collapsed first. In Korea, the debt sits with households. Household debt is 85.1% of GDP, and by the Bank of Korea's calculation a 20% fall in house prices would raise the share of high-risk households from 3.3% to 4.9%. When reading news about house prices, look at who in that country carries the most debt. That gives a sense of where a fall in prices would hurt first.